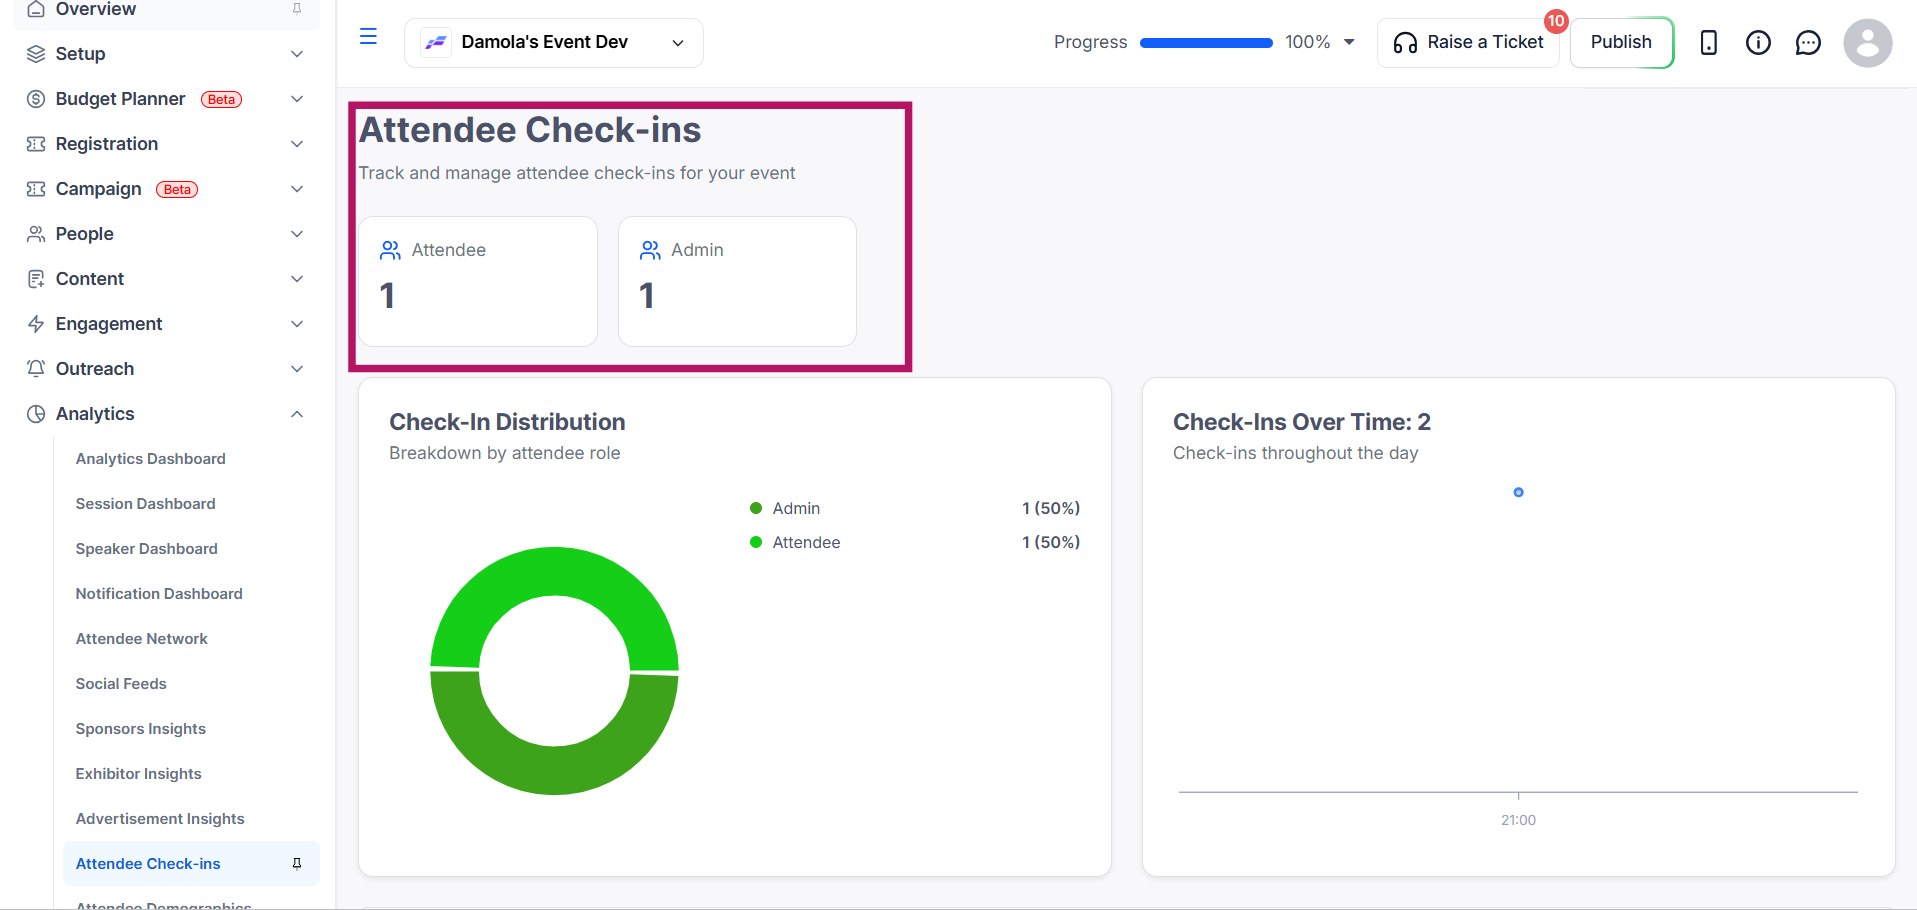
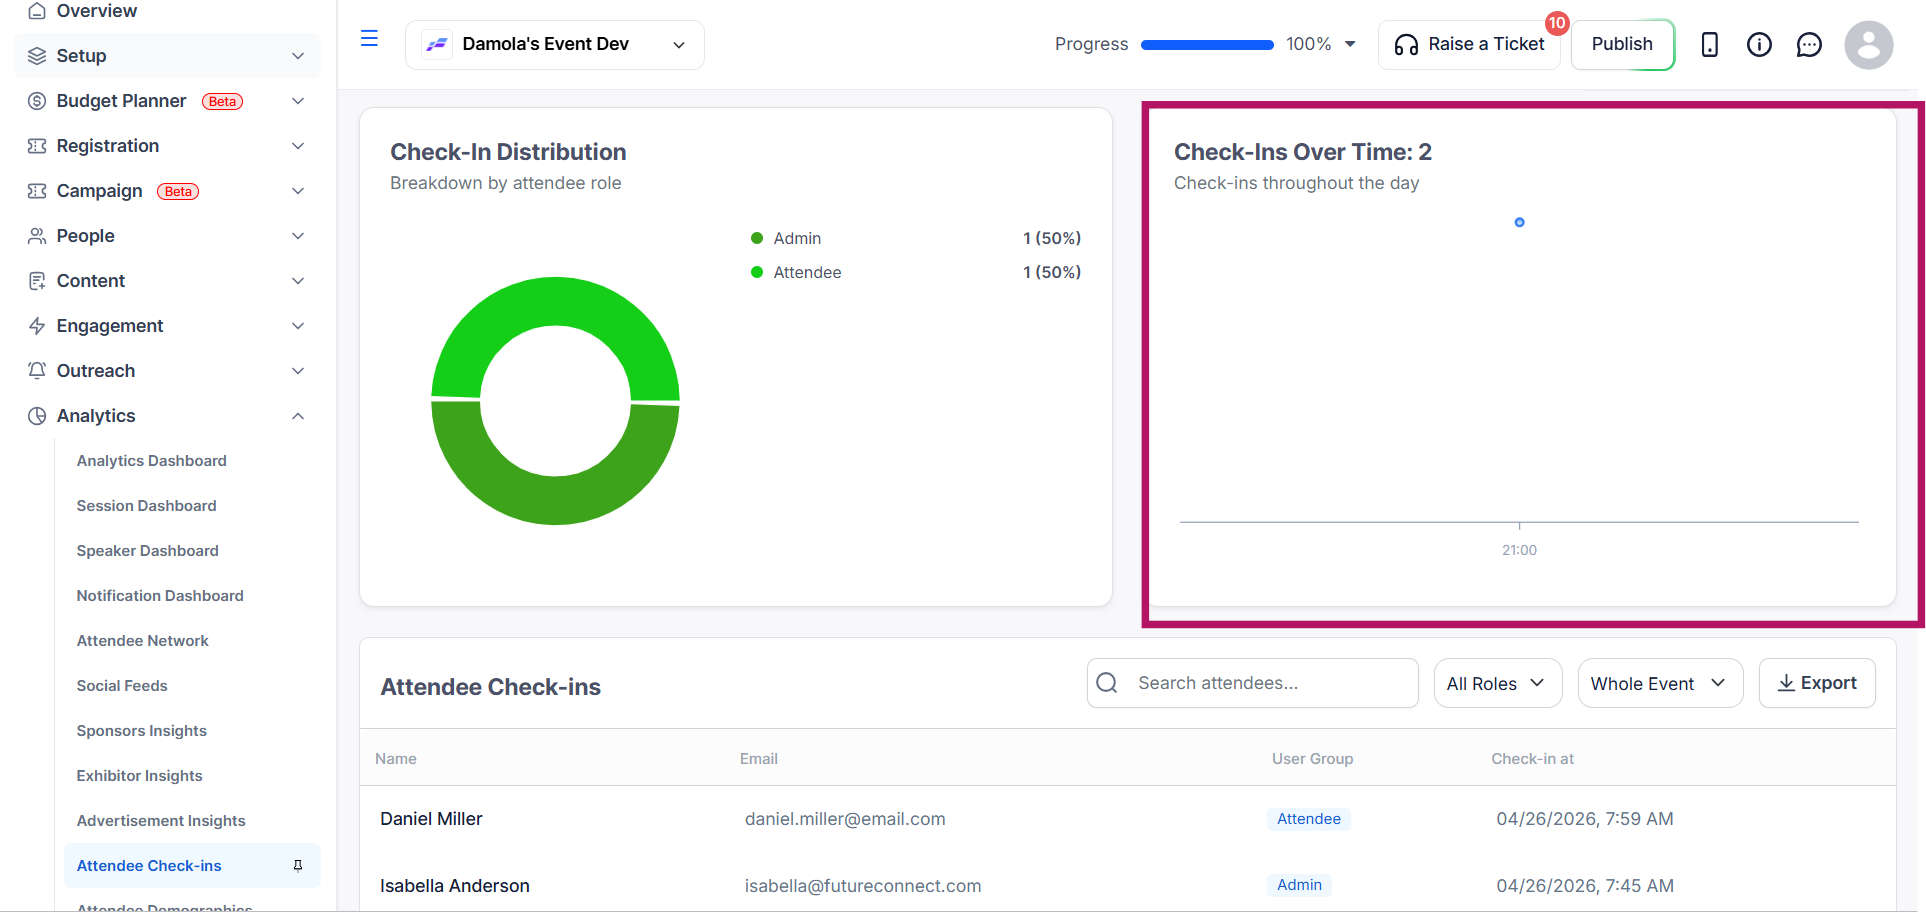
The Check-In Dashboard gives you a real-time view of attendee arrivals across your entire event. It shows check-in counts, distribution by user group, and a timeline of arrivals.
Go to Analytics in the sidebar and select Attendee Check-Ins (or the equivalent check-in analytics section).
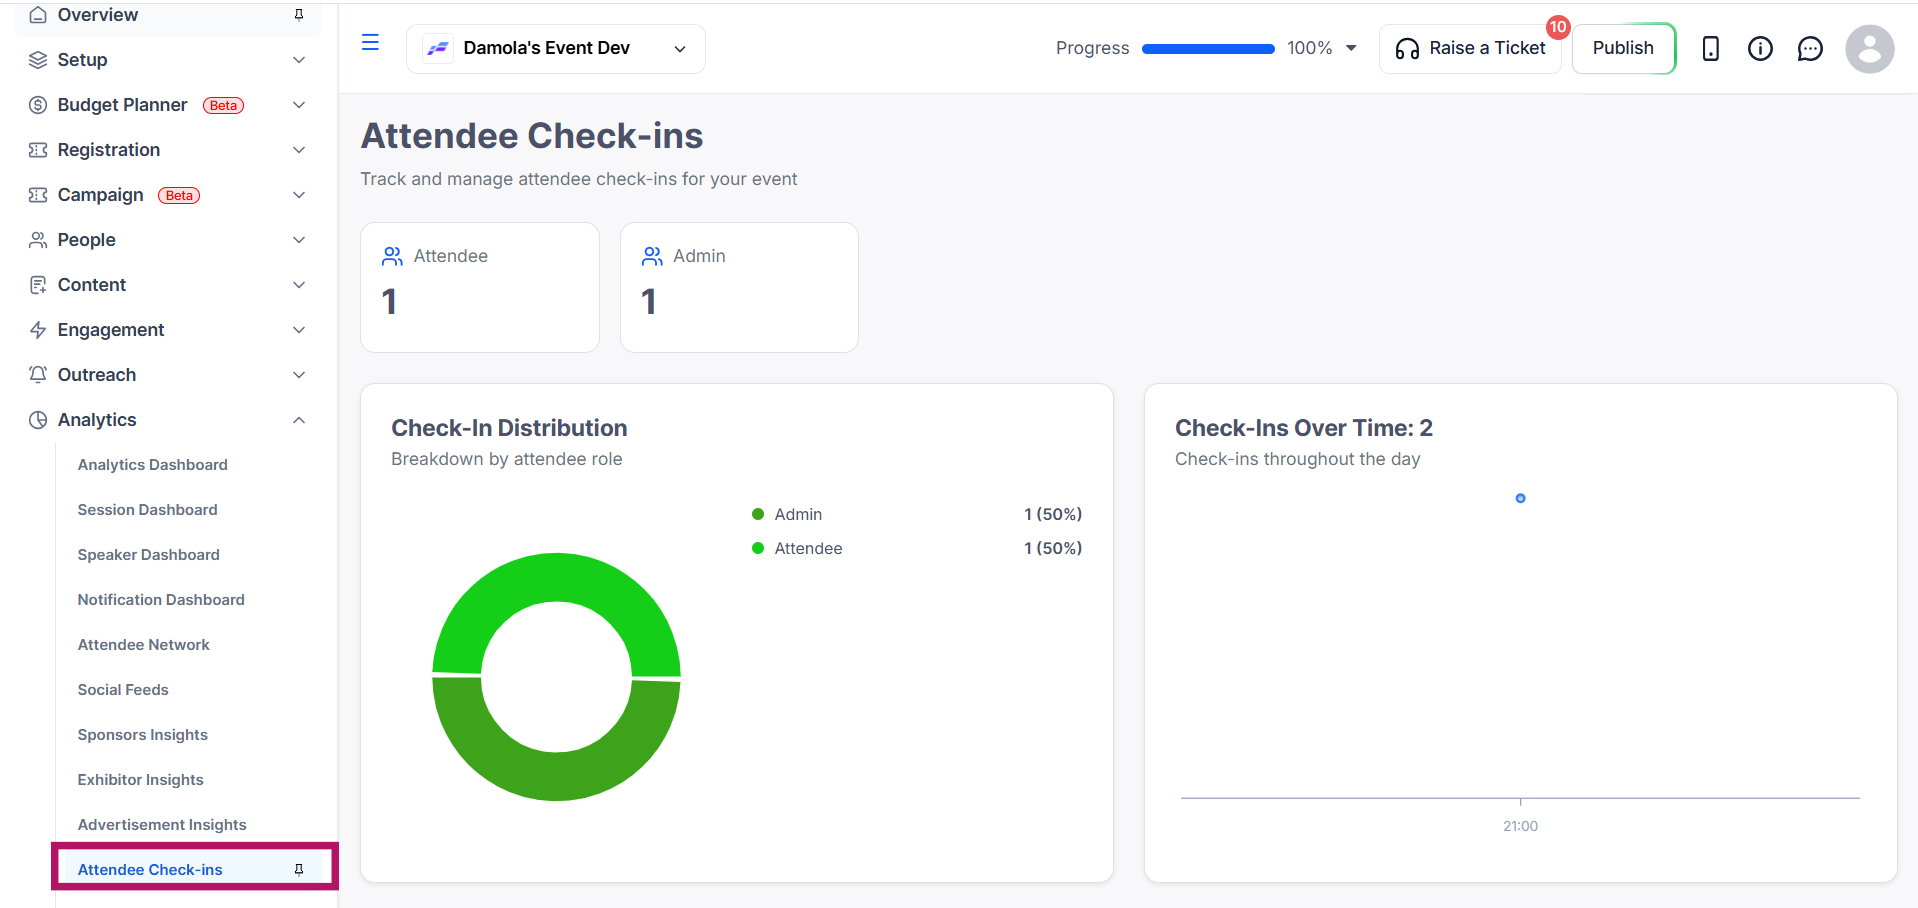
Displays the total number of check-ins by user group; one card per attendee (e.g., Attendees, Admins, Speakers, Exhibitors), giving you a quick snapshot of arrivals.
A visual breakdown of check-ins by role or user group, with counts and percentages. Use this to quickly see the proportion of each attendee type that has arrived.
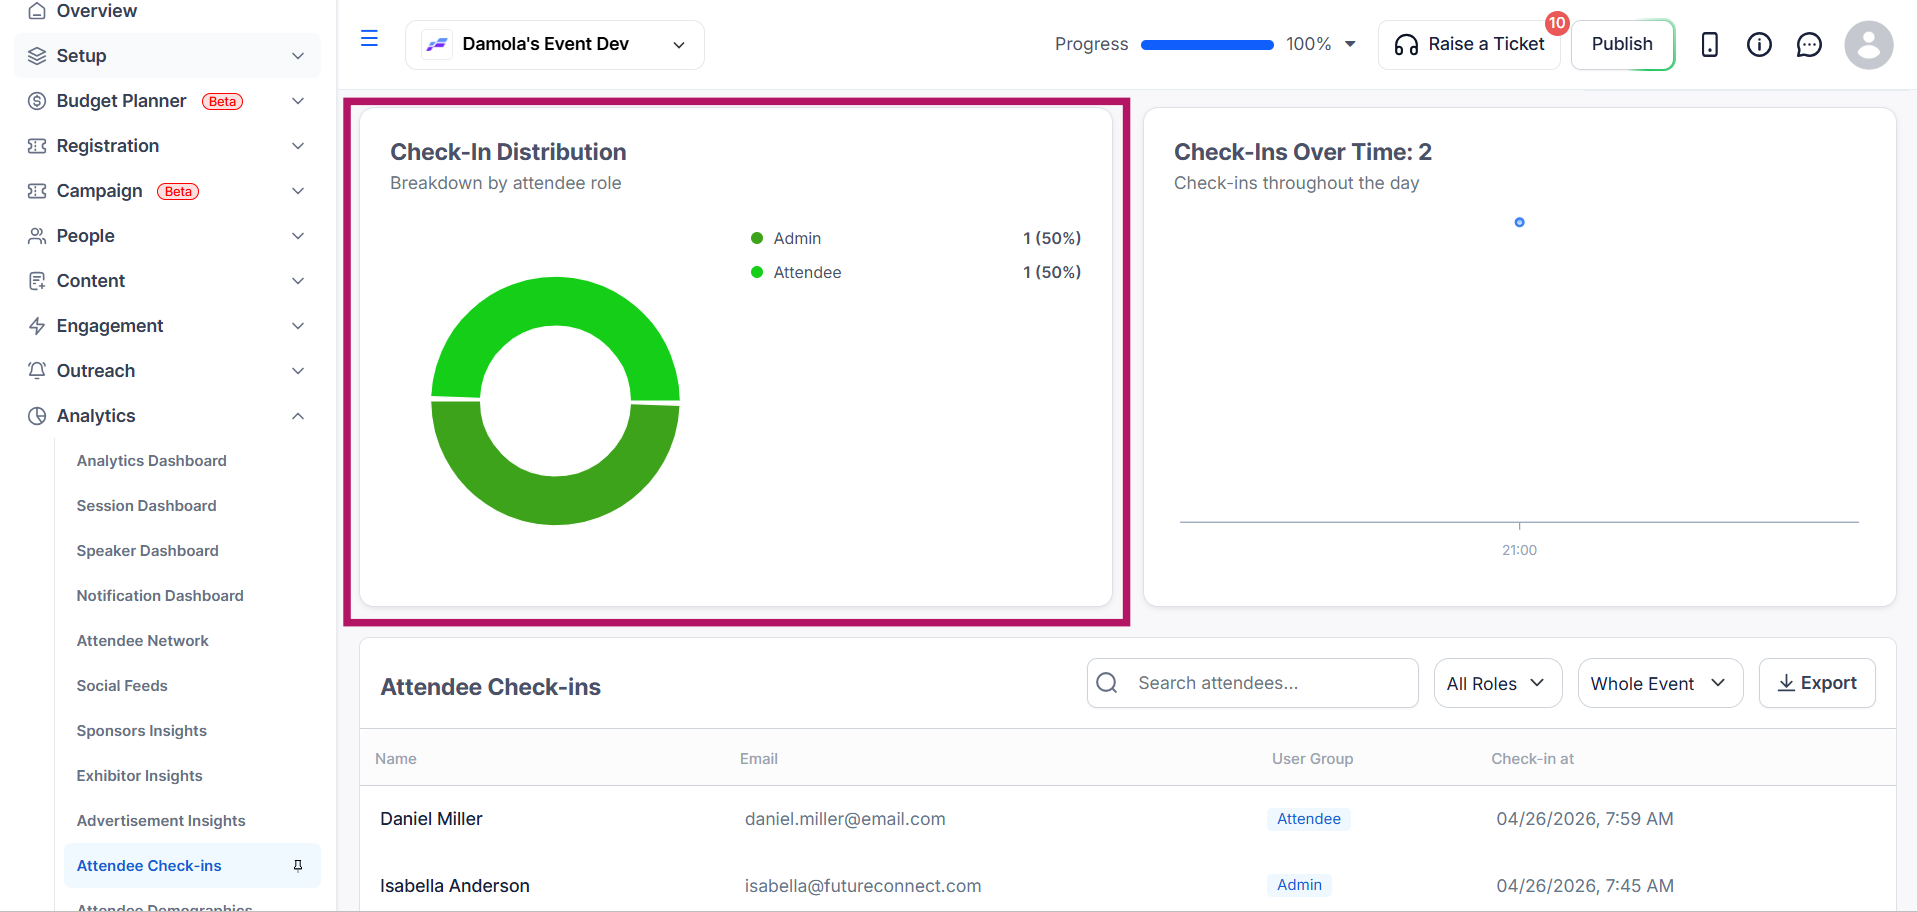
A cumulative line graph showing how check-ins accumulated throughout the event day(s), plotted in hourly intervals. Use this to identify peak arrival times.
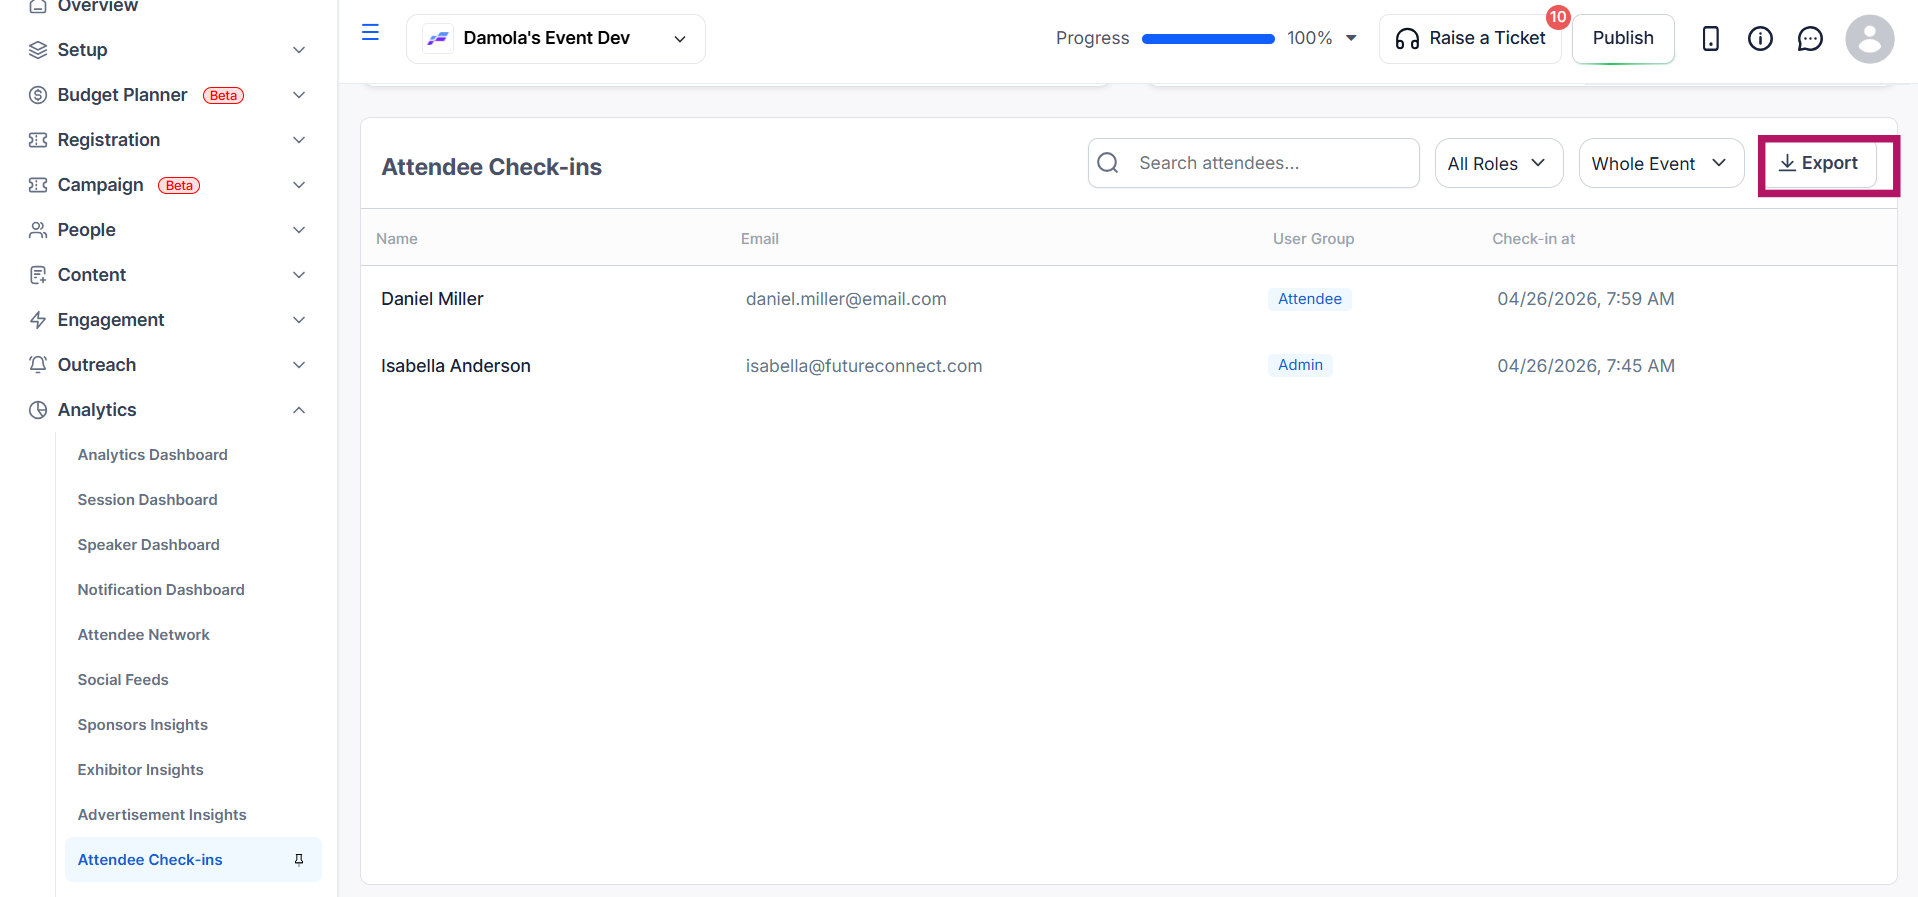
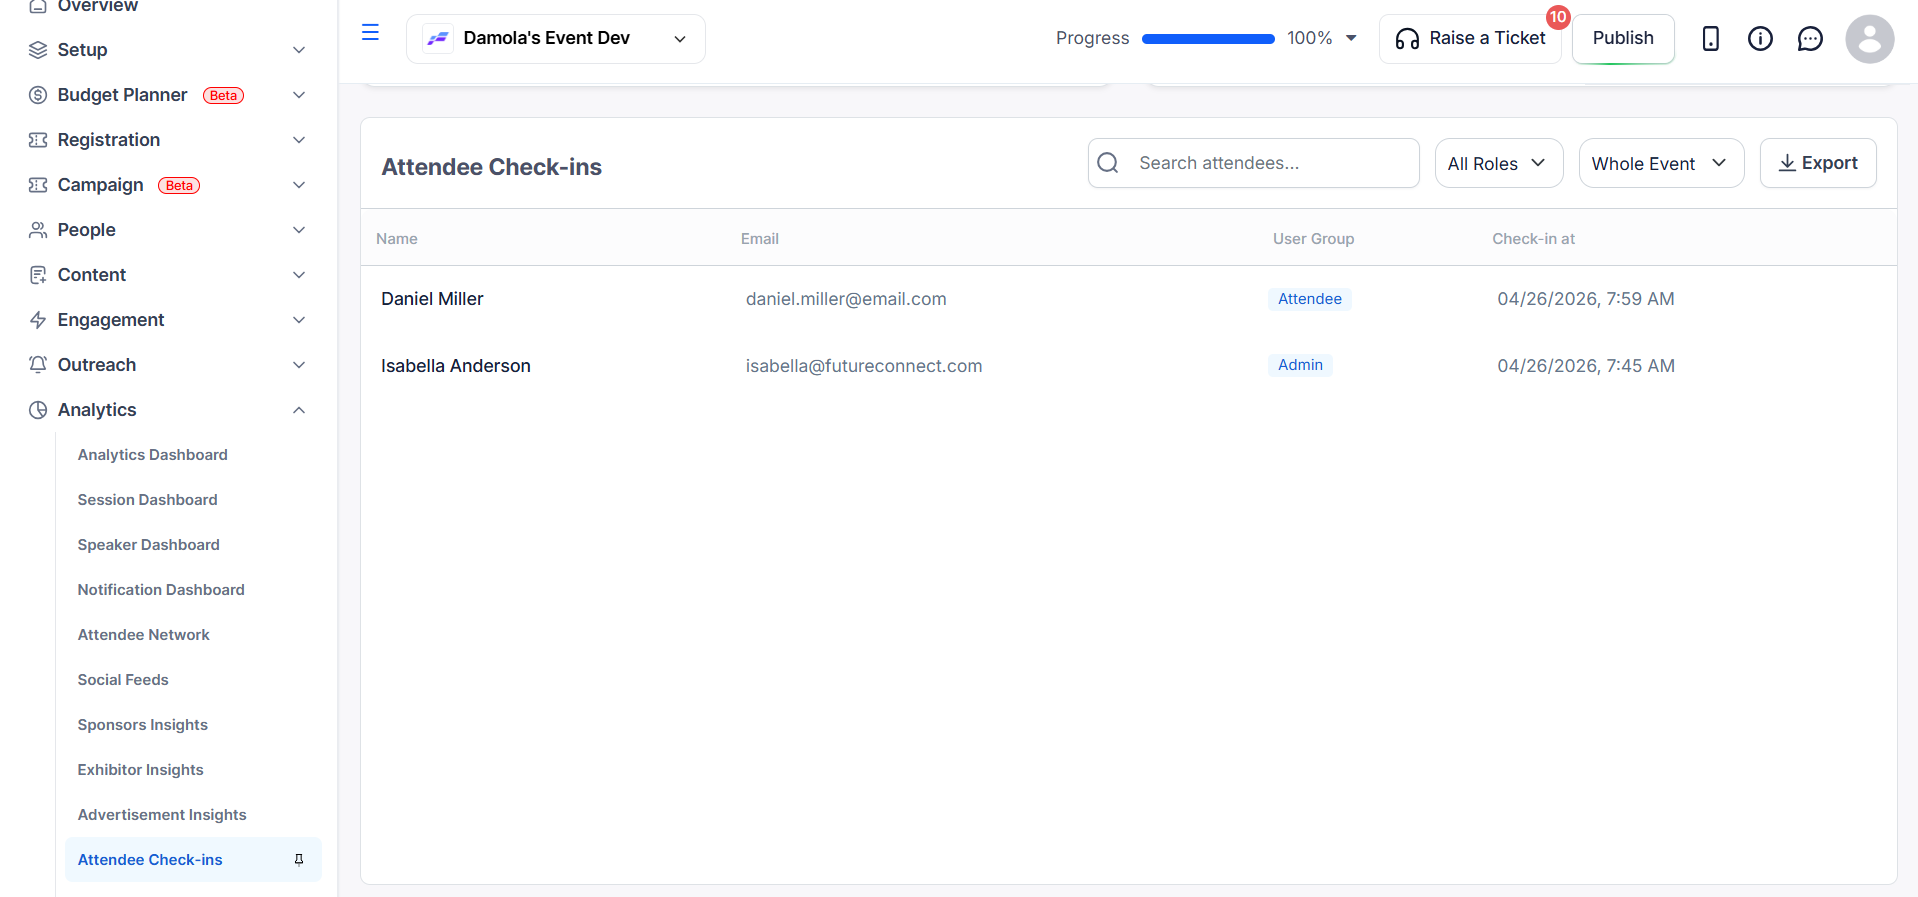
The Attendee Table is a searchable and filterable list of all checked-in attendees, displaying their name, email, user group, and check-in time.
Use the Role filter (All Roles, including attendee, speaker, sponsor, exhibitor, admin, etc.) to filter by user group, or the Event filter (Whole Event or specific event dates) to narrow results by event scope.
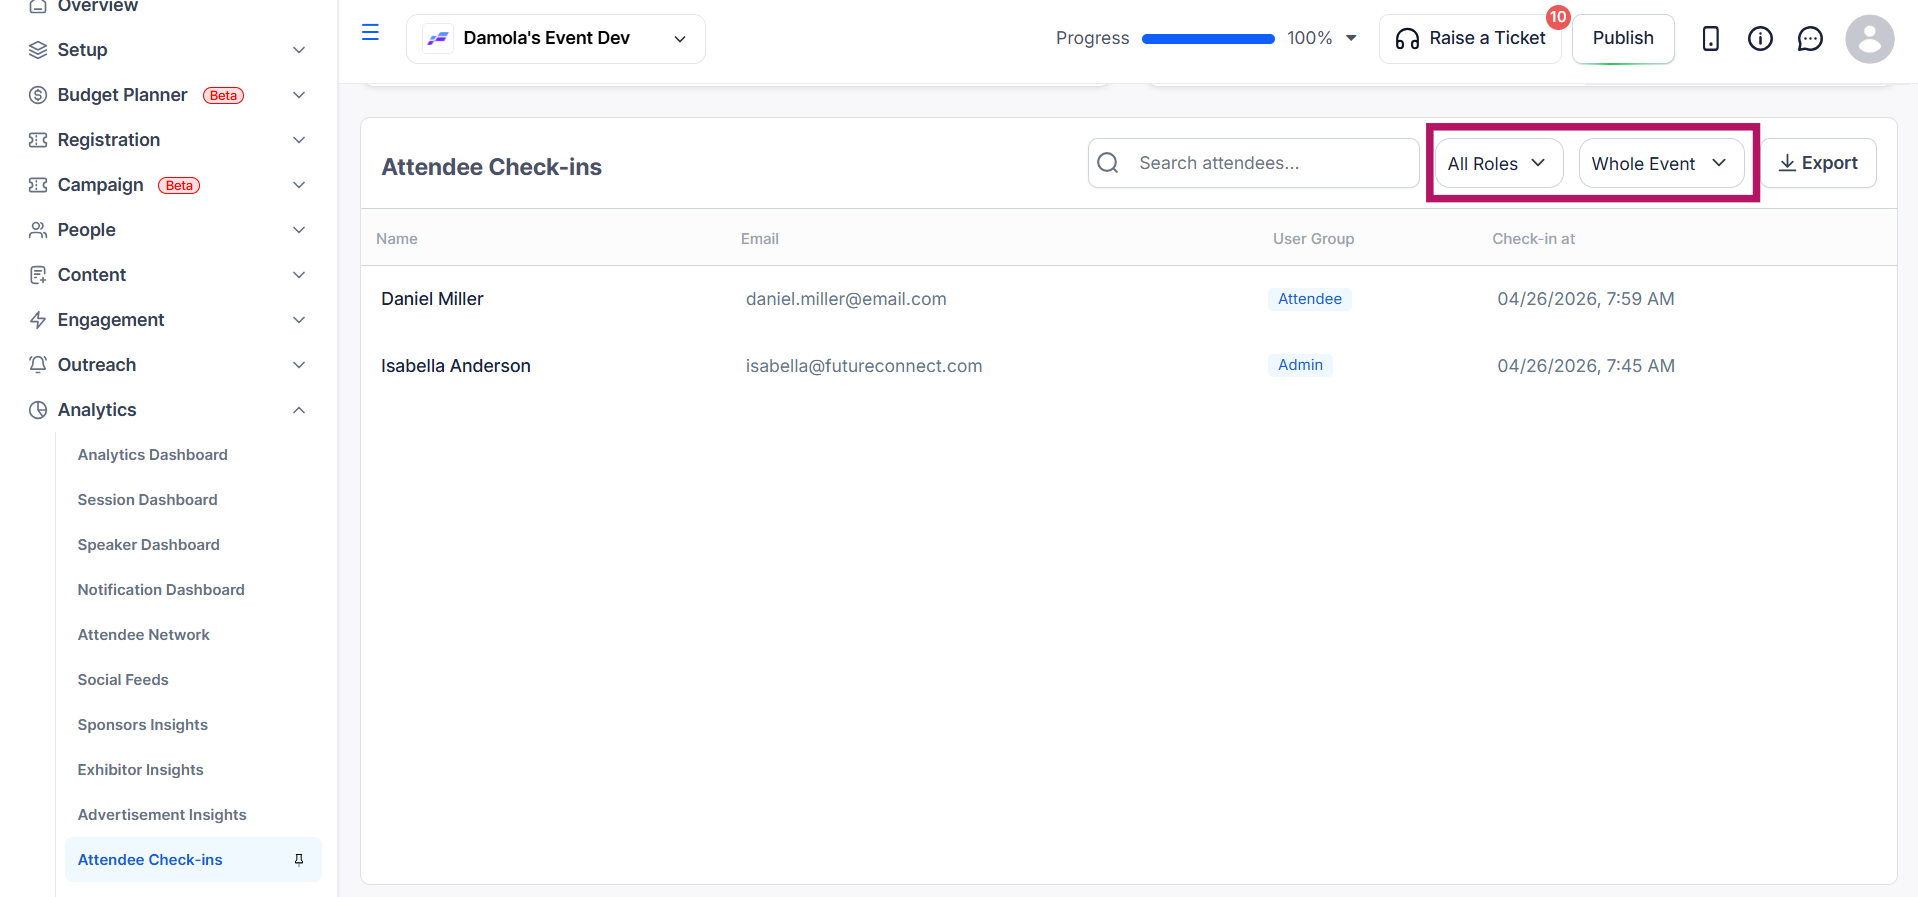
Click the Export button to download the check-in data as a CSV/Excel file. The exported file reflects any filters currently applied.